Previous Year | Previous Day | Next Day | Next Year |

Monday February 10th 2020 - number of obs: 1439 (99.9%)

TemperatureHumidity
Maximum
10.4°Cat 12:55
Maximum
90.0 %at 18:27
Minimum
3.1°Cat 07:08
Minimum
53.0 %at 20:30
Average6.8°C Average71.5 %
Rain (21Z D-1 to 21Z D)Sunshine
Total3.8 mmTotalN/A hours
PressureWind
Highest
1011.3 hPaat 08:34
Max Mean
12 knotsat 11:46
Lowest
999.8 hPaat 15:20
Max Gust
25 knotsat 13:18
Remarks
Nil

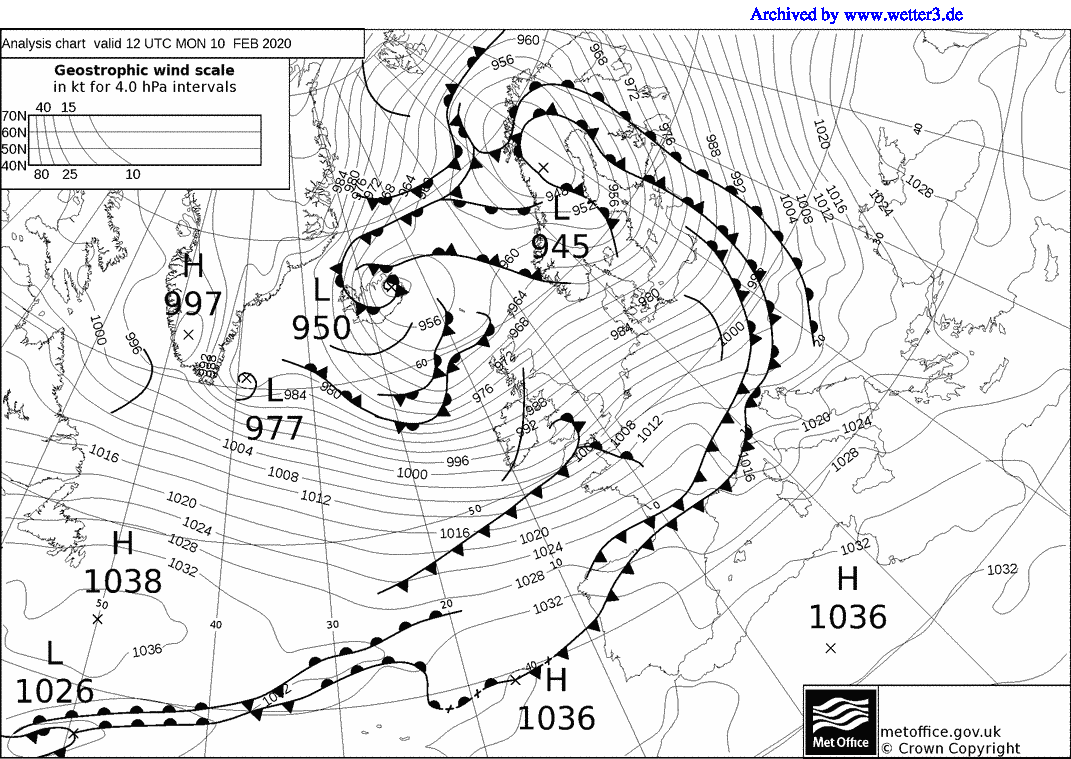
Met Office 12Z Analysis Chart

Daily Diary

No diary entry for this day

RoostCam South Timelapse | RoostCam North Timelapse


Rainfall on 10/02/2020
Line chart with 1439 data points.
Click and drag in the plot area to zoom in
The chart has 1 X axis displaying Time. Range: 2020-02-10 08:45:36 to 2020-02-11 09:13:23.
The chart has 1 Y axis displaying Rainfall. Range: 0 to 4.
Highcharts.com
End of interactive chart.

10-minute mean Wind Speed and Gust
Line chart with 2 lines.
Click and drag in the plot area to zoom in. Time in Zulu
The chart has 1 X axis displaying Time. Range: 2020-02-10 08:45:36 to 2020-02-11 09:13:23.
The chart has 1 Y axis displaying knots. Range: 0 to 30.
Highcharts.com
End of interactive chart.
Wind Direction
Line chart with 1439 data points.
Click and drag in the plot area to zoom in. Time in Zulu
The chart has 1 X axis displaying Time. Range: 2020-02-10 08:45:36 to 2020-02-11 09:13:23.
The chart has 1 Y axis displaying degrees. Range: 0 to 360.
Highcharts.com
End of interactive chart.
Wind Direction
Bar chart with 16 bars.
The chart has 1 X axis displaying categories.
The chart has 1 Y axis displaying Frequency (%). Range: 0 to 76.65.
Highcharts.com
End of interactive chart.
Table of Frequencies (percent)
Direction Frequency of Wind Direction
N 0
NNE 0
NE 0
ENE 0
E 0
ESE 0
SE 0
SSE 0
S 0
SSW 0
SW 5
WSW 5
W 73
WNW 17
NW 0
NNW 0
Total 25.53

Instantaneous PMSL
Line chart with 1439 data points.
Click and drag in the plot area to zoom in. Time in Zulu
The chart has 1 X axis displaying Time. Range: 2020-02-10 08:45:36 to 2020-02-11 09:13:23.
The chart has 1 Y axis displaying hPa. Range: 998 to 1012.
Highcharts.com
End of interactive chart.

Rolling 1-minute mean of Humidity
Line chart with 1439 data points.
Click and drag in the plot area to zoom in. Time in Zulu
The chart has 1 X axis displaying Time. Range: 2020-02-10 08:45:36 to 2020-02-11 09:13:23.
The chart has 1 Y axis displaying %. Range: 50 to 100.
Highcharts.com
End of interactive chart.

Cumulative Sunshine (hours)
Line chart with 1439 data points.
Click and drag in the plot area to zoom in
The chart has 1 X axis displaying Time. Range: 2020-02-09 23:45:36 to 2020-02-11 00:13:23.
The chart has 1 Y axis displaying hours. Range: 0 to 3.
Highcharts.com
End of interactive chart.
 
 
Buy Me A Coffee
Please consider supporting my site with a donation towards the ever increasing running costs!