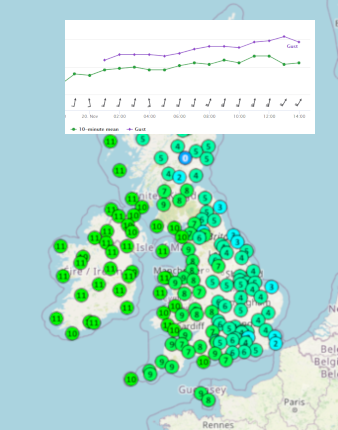
Links to observational data derived from SYNOP reports. Reports from 03xxx stations available in real-time, so includes some stations from Ireland as well as the UK, Jersey, Guernsey, and the Isle of Man. For example, check out Temperature, Wind/Gust, or Visibility
My estimated Integrated Radar page also lives in this section - estimate rainfall totals across the UK and compare with rain gauge reports, for any time period (up to 24 hours) over the past 30 days.
Anything to do with daily, monthly, seasonal, or annual summaries of conditions from official observational sites across the United Kingdom and Republic of Ireland, plotted on a map..
For example, check out daily rainfall, daily extremes, heatwaves, highest gust in the month, total sunshine in a season, annual mean temperature, and much, much more. You can even select a custom period for rainfall, sunshine totals, and wind gusts.
Data comes from WMO SYNOP reports, and for data up to and including 31/12/2020 some maps are now connected to my MIDAS Open database, which contains official data from the UK Met Office. I am slowly adding new maps and connecting existing ones to this more comprehensive, official dataset all the time.
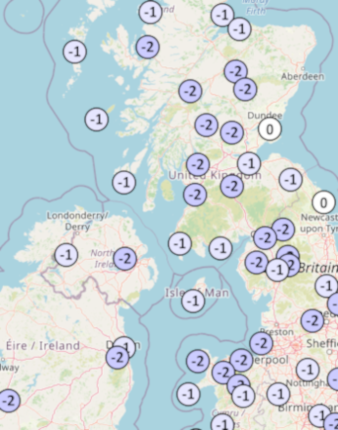
Anything to do with daily, monthly, or seasonal departures from climate (mainly 1981-2010 at this time), for temperature, rainfall and sunshine measured at official locations across the UK and Ireland, plotted on a map
For example, check out the recent daily minimum temperature anomaly, monthly rainfall anomaly, or seasonal sunshine anomalies.
Data currently is restricted to that derived from official WMO SYNOP reports, but, as with the summary maps, I intend to connect these up to MIDAS Open as well as add more parameters as time allows.
Daily, monthly, and all-time 30-year means and all-time extremes for individual official UK and Ireland observation stations, plotted on a map.
For example, check out the daily mean maximum temperature, monthly mean minimum temperature, monthly mean rainfall totals, or all-time extreme maximum temperature.My UK Climate Explorer also lives here - a neat visualisation of a selection of stations with long-term climate records provided on a monthly basis by the National Climate Information Centre.
Climate for most maps is currently 1981-2010 using data from the National Climate Information Centre, although daily climatologies are created using a 15-day running mean of 1991-2020 data from MIDAS Open, and as such are not currently available for Ireland.
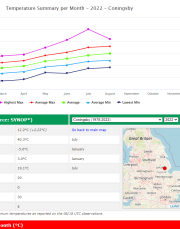
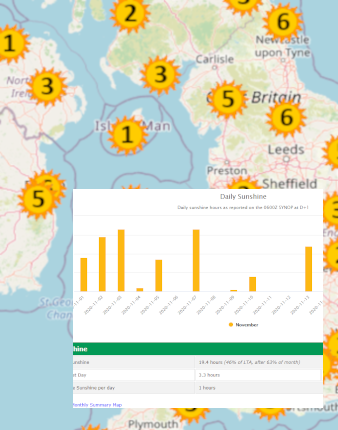
Graphical visulisations of observations, and selected statistics, mainly from indiividual official sites across the United Kingdom and Ireland.
For example, check out a daily rainfall graph, monthly sunshine total graph, or yearly temperature summary graph and heatmap. Some UK wide parameters are also available, such as the maximum diurnal range.
Data is currently derived from WMO SYNOP data going back to 2021 (or 2000, in some cases), but as with everything else, I am slowly connecting the graphs up to my MIDAS dataset which will give much more comprehensive and long-duration records. Due to the difficulty of meshing together SYNOP and MIDAS data seamlessly, there'll likely be some parts of these pages which are broken, so be careful when looking at the data for now!
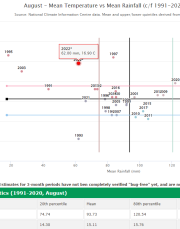
Mixture of different plots, generally all relating to climatologies or summaries of conditions over a period of a month or more from station to countrywide scales.
You can look at daily temperature anomalies averaged across the UK, see the regional/country variation of rainfall for all years going back to 1862, see how winter sunshine has varied in East Anglia since 1919, check out the latest Central England Temperature, look at daily (1991-2020) and monthly (1981-2010) climatology through the year for individual stations, or see how many days the temperature was above 30°C in the UK for each year going back to 1853.
Heavy use is made of data from the National Climate Information Centre, including MIDAS Open. Data for the current month is for some applications estimated using data obtained from SYNOP reports, and replaced by official data as it comes in.
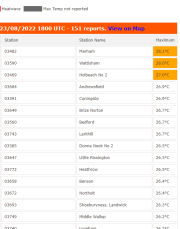
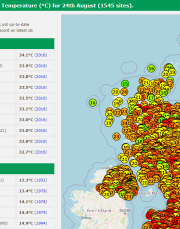
Tables of various daily weather parameters ranked by highest, lowest etc.
Take a look at the Top 10 temperature, wind gusts, pressure for any day back to 2020, or see the heatwave summary for individual stations over the past 3 days.
Data currently comes from processed SYNOP reports, with plans to integrate MIDAS Open
A basic page containing some information about the various reports contained within the Roost Weather Database.