Previous Year | Previous Day | Next Day | Next Year |

Saturday December 19th 2020 - number of obs: 1440 (100%)

TemperatureHumidity
Maximum
11.6°Cat 14:04
Maximum
89.0 %at 07:39
Minimum
4.4°Cat 06:41
Minimum
71.0 %at 13:33
Average8.0°C Average80.0 %
Rain (21Z D-1 to 21Z D)Sunshine
Total11.0 mmTotalN/A hours
PressureWind
Highest
1011.8 hPaat 08:49
Max Mean
8 knotsat 12:05
Lowest
1001.6 hPaat 09:00
Max Gust
13 knotsat 13:42
Remarks
Nil

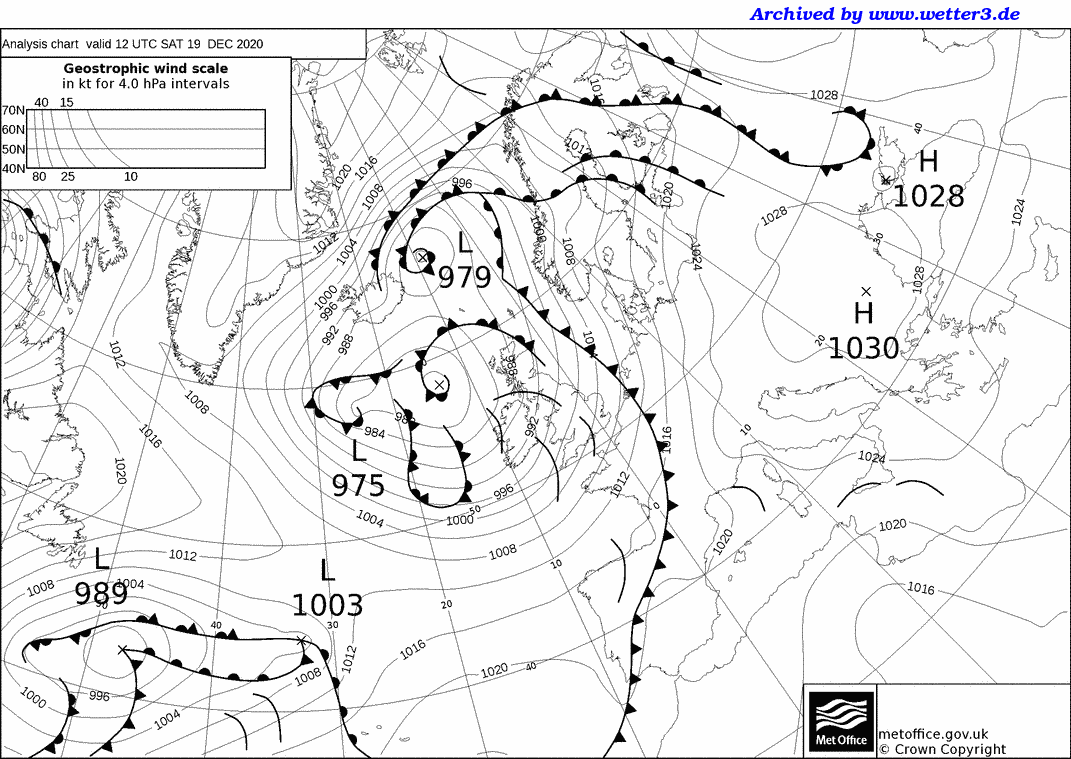
Met Office 12Z Analysis Chart

Daily Diary

Rain overnight, heavy at times, cleared by the morning, to clear/sunny spells and showers. Brisk SW'ly wind, and remaining rather mild. Showers cleared to leave a clear and increasingly cold evening and overnight.

RoostCam South Timelapse | RoostCam North Timelapse

Temperature and Dew Point on 19/12/2020
Line chart with 3 lines.
Click and drag in the plot area to zoom in. Time in Zulu
The chart has 1 X axis displaying Time. Range: 2020-12-19 08:45:36 to 2020-12-20 09:13:23.
The chart has 1 Y axis displaying Temperature/Dew Point. Range: 0 to 14.
Highcharts.com
End of interactive chart.

Rainfall on 19/12/2020
Line chart with 1440 data points.
Click and drag in the plot area to zoom in
The chart has 1 X axis displaying Time. Range: 2020-12-19 08:45:36 to 2020-12-20 09:13:23.
The chart has 1 Y axis displaying Rainfall. Range: 0 to 1.
Highcharts.com
End of interactive chart.

10-minute mean Wind Speed and Gust
Line chart with 2 lines.
Click and drag in the plot area to zoom in. Time in Zulu
The chart has 1 X axis displaying Time. Range: 2020-12-19 08:45:36 to 2020-12-20 09:13:23.
The chart has 1 Y axis displaying knots. Range: 0 to 15.
Highcharts.com
End of interactive chart.
Wind Direction
Line chart with 1440 data points.
Click and drag in the plot area to zoom in. Time in Zulu
The chart has 1 X axis displaying Time. Range: 2020-12-19 08:45:36 to 2020-12-20 09:13:23.
The chart has 1 Y axis displaying degrees. Range: 0 to 360.
Highcharts.com
End of interactive chart.
Wind Direction
Bar chart with 16 bars.
The chart has 1 X axis displaying categories.
The chart has 1 Y axis displaying Frequency (%). Range: 0 to 37.8.
Highcharts.com
End of interactive chart.
Table of Frequencies (percent)
Direction Frequency of Wind Direction
N 0
NNE 0
NE 0
ENE 0
E 0
ESE 0
SE 0
SSE 0
S 9
SSW 32
SW 36
WSW 5
W 2
WNW 0
NW 0
NNW 0
Total 25.53

Instantaneous PMSL
Line chart with 1440 data points.
Click and drag in the plot area to zoom in. Time in Zulu
The chart has 1 X axis displaying Time. Range: 2020-12-19 08:45:36 to 2020-12-20 09:13:23.
The chart has 1 Y axis displaying hPa. Range: 1000 to 1014.
Highcharts.com
End of interactive chart.

Rolling 1-minute mean of Humidity
Line chart with 1440 data points.
Click and drag in the plot area to zoom in. Time in Zulu
The chart has 1 X axis displaying Time. Range: 2020-12-19 08:45:36 to 2020-12-20 09:13:23.
The chart has 1 Y axis displaying %. Range: 70 to 90.
Highcharts.com
End of interactive chart.

Cumulative Sunshine (hours)
Line chart with 1440 data points.
Click and drag in the plot area to zoom in
The chart has 1 X axis displaying Time. Range: 2020-12-18 23:45:36 to 2020-12-20 00:13:23.
The chart has 1 Y axis displaying hours. Range: -0.5 to 0.5.
Highcharts.com
End of interactive chart.
 
 
Buy Me A Coffee
Please consider supporting my site with a donation towards the ever increasing running costs!