Warning: Undefined array key 1439 in /share/CACHEDEV1_DATA/Web/weather/includes/day__stats_sql.php on line 99

Warning: Trying to access array offset on value of type null in /share/CACHEDEV1_DATA/Web/weather/includes/day__stats_sql.php on line 99

Warning: Undefined array key 1439 in /share/CACHEDEV1_DATA/Web/weather/includes/day__stats_sql.php on line 100

Warning: Trying to access array offset on value of type null in /share/CACHEDEV1_DATA/Web/weather/includes/day__stats_sql.php on line 100
Starlings Roost Weather

Previous Year | Previous Day | Next Day | Next Year |

Tuesday January 5th 2021 - number of obs: 1440 (100%)

TemperatureHumidity
Maximum
4.9°Cat 13:07
Maximum
81.0 %at 03:11
Minimum
2.2°Cat 09:00
Minimum
71.0 %at 13:18
Average3.6°C Average76.0 %
Rain (21Z D-1 to 21Z D)Sunshine
Total0.1 mmTotalN/A hours
PressureWind
Highest
1022.7 hPaat 09:29
Max Mean
8 knotsat 13:21
Lowest
1020.3 hPaat 13:46
Max Gust
16 knotsat 13:33
Remarks
Nil

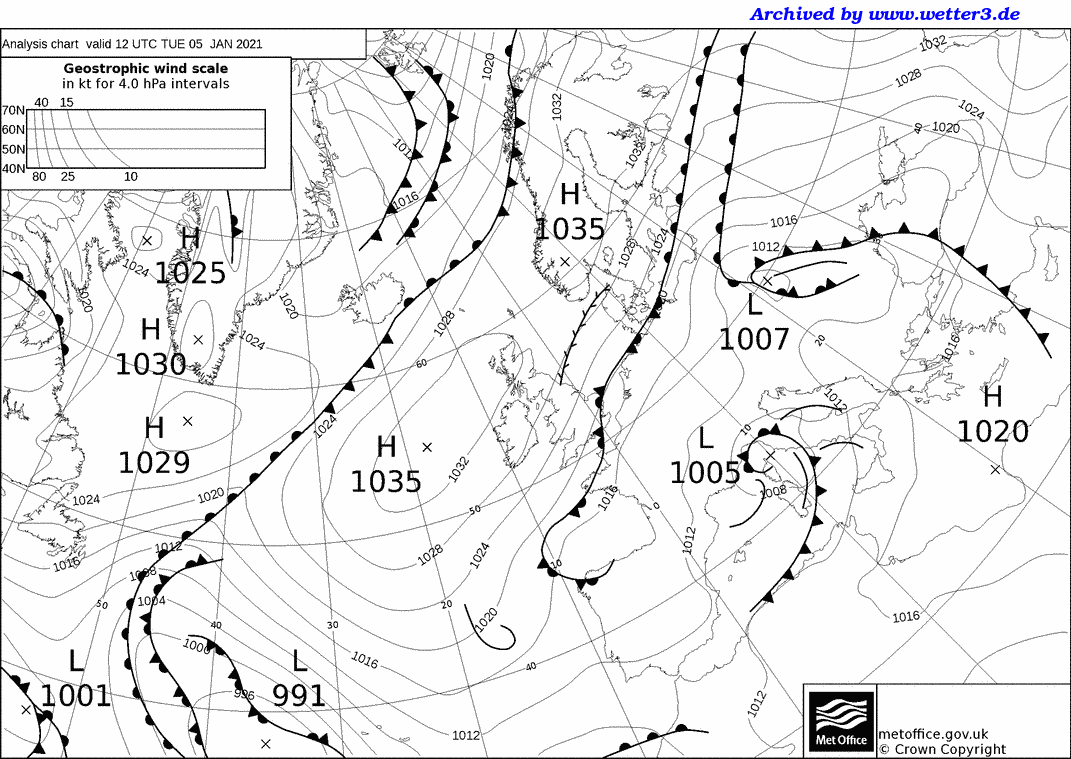
Met Office 12Z Analysis Chart

Daily Diary

A fine and mainly dry day with plenty of sunny spells, although with a moderate to fresh north-easterly wind, making it feel very cold. The odd light shower, mainly after dusk. Cold.

RoostCam South Timelapse | RoostCam North Timelapse

Temperature and Dew Point on 05/01/2021
Line chart with 3 lines.
Click and drag in the plot area to zoom in. Time in Zulu
The chart has 1 X axis displaying Time. Range: 2021-01-05 08:45:36 to 2021-01-06 09:13:23.
The chart has 1 Y axis displaying Temperature/Dew Point. Range: -2 to 6.
Highcharts.com
End of interactive chart.

Rainfall on 05/01/2021
Line chart with 1440 data points.
Click and drag in the plot area to zoom in
The chart has 1 X axis displaying Time. Range: 2021-01-05 08:45:36 to 2021-01-06 09:13:23.
The chart has 1 Y axis displaying Rainfall. Range: -0.5 to 0.5.
Highcharts.com
End of interactive chart.

10-minute mean Wind Speed and Gust
Line chart with 2 lines.
Click and drag in the plot area to zoom in. Time in Zulu
The chart has 1 X axis displaying Time. Range: 2021-01-05 08:45:36 to 2021-01-06 09:13:23.
The chart has 1 Y axis displaying knots. Range: 0 to 20.
Highcharts.com
End of interactive chart.
Wind Direction
Line chart with 1440 data points.
Click and drag in the plot area to zoom in. Time in Zulu
The chart has 1 X axis displaying Time. Range: 2021-01-05 08:45:36 to 2021-01-06 09:13:23.
The chart has 1 Y axis displaying degrees. Range: 0 to 360.
Highcharts.com
End of interactive chart.
Wind Direction
Bar chart with 16 bars.
The chart has 1 X axis displaying categories.
The chart has 1 Y axis displaying Frequency (%). Range: 0 to 60.9.
Highcharts.com
End of interactive chart.
Table of Frequencies (percent)
Direction Frequency of Wind Direction
N 58
NNE 25
NE 2
ENE 0
E 0
ESE 0
SE 0
SSE 0
S 0
SSW 0
SW 0
WSW 0
W 0
WNW 0
NW 0
NNW 13
Total 25.53

Instantaneous PMSL
Line chart with 1440 data points.
Click and drag in the plot area to zoom in. Time in Zulu
The chart has 1 X axis displaying Time. Range: 2021-01-05 08:45:36 to 2021-01-06 09:13:23.
The chart has 1 Y axis displaying hPa. Range: 1020 to 1023.
Highcharts.com
End of interactive chart.

Rolling 1-minute mean of Humidity
Line chart with 1440 data points.
Click and drag in the plot area to zoom in. Time in Zulu
The chart has 1 X axis displaying Time. Range: 2021-01-05 08:45:36 to 2021-01-06 09:13:23.
The chart has 1 Y axis displaying %. Range: 70 to 82.
Highcharts.com
End of interactive chart.


Buy Me A Coffee
Please consider supporting my site with a donation towards the ever increasing running costs!