Previous Year | Previous Day | Next Day | Next Year |

Tuesday July 5th 2022 - number of obs: 1425 (99%)

TemperatureHumidity
Maximum
20.6°Cat 16:52
Maximum
90.0 %at 06:15
Minimum
12.2°Cat 04:05
Minimum
62.0 %at 09:00
Average16.4°C Average76.0 %
Rain (21Z D-1 to 21Z D)Sunshine
Total0.0 mmTotal6.0 hours
PressureWind
Highest
1030.3 hPaat 07:27
Max Mean
5 knotsat 11:02
Lowest
1026.8 hPaat 09:01
Max Gust
12 knotsat 17:30
Remarks
Nil

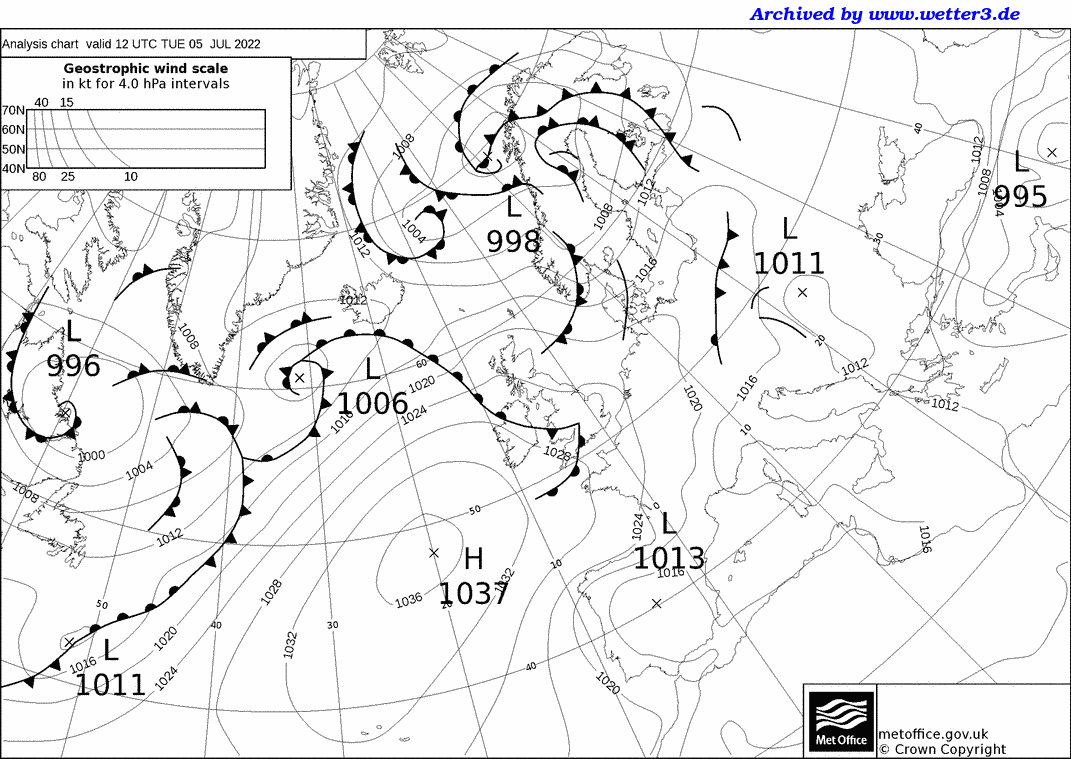
Met Office 12Z Analysis Chart

Daily Diary

Despite the warm front wave indicated on the chart, a fairly pleasant day with a fair amount of layer cloud during the morning, but increasingly amounts of sunshine developing during the afternoon, especially later on. Dry, and warmer than recent days with temperatures closer to the average for the time of year. Dry, with a light WNW'ly wind.

RoostCam South Timelapse | RoostCam North Timelapse

Temperature and Dew Point on 05/07/2022
Line chart with 3 lines.
Click and drag in the plot area to zoom in. Time in Zulu
The chart has 1 X axis displaying Time. Range: 2022-07-05 08:45:36 to 2022-07-06 09:13:23.
The chart has 1 Y axis displaying Temperature/Dew Point. Range: 5 to 25.
Highcharts.com
End of interactive chart.

Rainfall on 05/07/2022
Line chart with 1425 data points.
Click and drag in the plot area to zoom in
The chart has 1 X axis displaying Time. Range: 2022-07-05 08:45:36 to 2022-07-06 09:13:23.
The chart has 1 Y axis displaying Rainfall. Range: -0.5 to 0.5.
Highcharts.com
End of interactive chart.

10-minute mean Wind Speed and Gust
Line chart with 2 lines.
Click and drag in the plot area to zoom in. Time in Zulu
The chart has 1 X axis displaying Time. Range: 2022-07-05 08:45:36 to 2022-07-06 09:13:23.
The chart has 1 Y axis displaying knots. Range: 0 to 14.
Highcharts.com
End of interactive chart.
Wind Direction
Line chart with 1425 data points.
Click and drag in the plot area to zoom in. Time in Zulu
The chart has 1 X axis displaying Time. Range: 2022-07-05 08:45:36 to 2022-07-06 09:13:23.
The chart has 1 Y axis displaying degrees. Range: 0 to 360.
Highcharts.com
End of interactive chart.
Wind Direction
Bar chart with 16 bars.
The chart has 1 X axis displaying categories.
The chart has 1 Y axis displaying Frequency (%). Range: 0 to 19.95.
Highcharts.com
End of interactive chart.
Table of Frequencies (percent)
Direction Frequency of Wind Direction
N 2
NNE 0
NE 1
ENE 1
E 2
ESE 1
SE 1
SSE 1
S 0
SSW 0
SW 0
WSW 3
W 16
WNW 19
NW 10
NNW 5
Total 25.53

Instantaneous PMSL
Line chart with 1425 data points.
Click and drag in the plot area to zoom in. Time in Zulu
The chart has 1 X axis displaying Time. Range: 2022-07-05 08:45:36 to 2022-07-06 09:13:23.
The chart has 1 Y axis displaying hPa. Range: 1026 to 1031.
Highcharts.com
End of interactive chart.

Rolling 1-minute mean of Humidity
Line chart with 1425 data points.
Click and drag in the plot area to zoom in. Time in Zulu
The chart has 1 X axis displaying Time. Range: 2022-07-05 08:45:36 to 2022-07-06 09:13:23.
The chart has 1 Y axis displaying %. Range: 60 to 100.
Highcharts.com
End of interactive chart.

Cumulative Sunshine (hours)
Line chart with 1425 data points.
Click and drag in the plot area to zoom in
The chart has 1 X axis displaying Time. Range: 2022-07-04 23:45:36 to 2022-07-06 00:13:23.
The chart has 1 Y axis displaying hours. Range: 0 to 8.
Highcharts.com
End of interactive chart.
 
 
Buy Me A Coffee
Please consider supporting my site with a donation towards the ever increasing running costs!