Previous Year | Previous Day | Next Day | Next Year |

Tuesday November 15th 2022 - number of obs: 1439 (99.9%)

TemperatureHumidity
Maximum
12.2°Cat 13:25
Maximum
92.0 %at 07:27
Minimum
6.3°Cat 06:48
Minimum
81.0 %at 18:46
Average9.3°C Average86.5 %
Rain (21Z D-1 to 21Z D)Sunshine
Total20.5 mmTotal1.0 hours
PressureWind
Highest
993.0 hPaat 11:04
Max Mean
0 knotsat 09:00
Lowest
989.2 hPaat 08:50
Max Gust
0 knotsat 09:00
Remarks
Nil

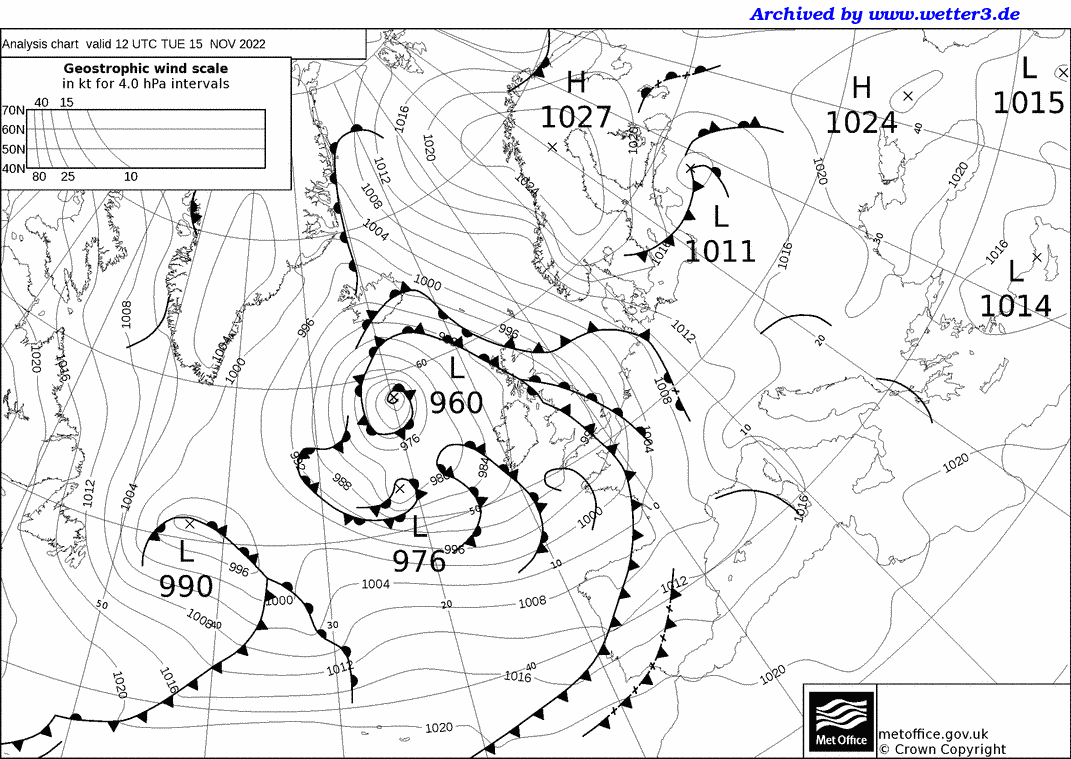
Met Office 12Z Analysis Chart

Daily Diary

Very heavy rain overnight cleared to sunny spells and showers associated with a strongly cyclonic pattern with occlusion debris. Showers continued into the evening and overnight. Strong S'ly wind before becoming lighter WSW'ly post cold front. Very mild overnight, temperatures just a little above average by day (early max).

RoostCam South Timelapse | RoostCam North Timelapse


Rainfall on 15/11/2022
Line chart with 1439 data points.
Click and drag in the plot area to zoom in
The chart has 1 X axis displaying Time. Range: 2022-11-15 08:45:36 to 2022-11-16 09:13:23.
The chart has 1 Y axis displaying Rainfall. Range: -0.5 to 0.5.
Highcharts.com
End of interactive chart.

10-minute mean Wind Speed and Gust
Line chart with 2 lines.
Click and drag in the plot area to zoom in. Time in Zulu
The chart has 1 X axis displaying Time. Range: 2022-11-15 08:45:36 to 2022-11-16 09:13:23.
The chart has 1 Y axis displaying knots. Range: -0.5 to 0.5.
Highcharts.com
End of interactive chart.
Wind Direction
Line chart with 1439 data points.
Click and drag in the plot area to zoom in. Time in Zulu
The chart has 1 X axis displaying Time. Range: 2022-11-15 08:45:36 to 2022-11-16 09:13:23.
The chart has 1 Y axis displaying degrees. Range: 0 to 360.
Highcharts.com
End of interactive chart.
Wind Direction
Bar chart with 16 bars.
The chart has 1 X axis displaying categories.
The chart has 1 Y axis displaying Frequency (%). Range: -0.5 to 0.5.
Highcharts.com
End of interactive chart.
Table of Frequencies (percent)
Direction Frequency of Wind Direction
N 0
NNE 0
NE 0
ENE 0
E 0
ESE 0
SE 0
SSE 0
S 0
SSW 0
SW 0
WSW 0
W 0
WNW 0
NW 0
NNW 0
Total 25.53

Instantaneous PMSL
Line chart with 1439 data points.
Click and drag in the plot area to zoom in. Time in Zulu
The chart has 1 X axis displaying Time. Range: 2022-11-15 08:45:36 to 2022-11-16 09:13:23.
The chart has 1 Y axis displaying hPa. Range: 989 to 994.
Highcharts.com
End of interactive chart.

Rolling 1-minute mean of Humidity
Line chart with 1439 data points.
Click and drag in the plot area to zoom in. Time in Zulu
The chart has 1 X axis displaying Time. Range: 2022-11-15 08:45:36 to 2022-11-16 09:13:23.
The chart has 1 Y axis displaying %. Range: 80 to 94.
Highcharts.com
End of interactive chart.

Cumulative Sunshine (hours)
Line chart with 1439 data points.
Click and drag in the plot area to zoom in
The chart has 1 X axis displaying Time. Range: 2022-11-14 23:45:36 to 2022-11-16 00:13:23.
The chart has 1 Y axis displaying hours. Range: 0 to 1.25.
Highcharts.com
End of interactive chart.
 
 
Buy Me A Coffee
Please consider supporting my site with a donation towards the ever increasing running costs!