Previous Year | Previous Day | Next Day | Next Year |

Monday March 13th 2023 - number of obs: 1440 (100%)

TemperatureHumidity
Maximum
13.6°Cat 11:03
Maximum
82.0 %at 21:47
Minimum
5.3°Cat 06:40
Minimum
63.0 %at 11:16
Average9.5°C Average72.5 %
Rain (21Z D-1 to 21Z D)Sunshine
Total2.3 mmTotal0.2 hours
PressureWind
Highest
1005.8 hPaat 08:59
Max Mean
0 knotsat 09:00
Lowest
987.0 hPaat 16:30
Max Gust
0 knotsat 09:00
Remarks
Nil

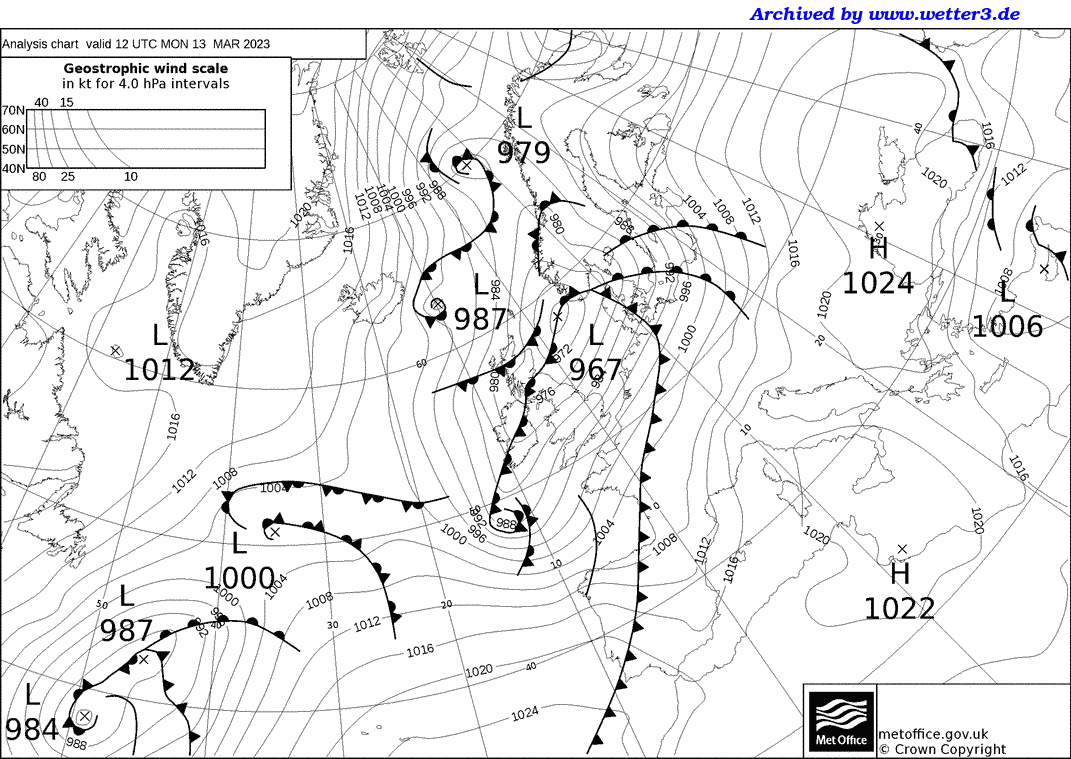
Met Office 12Z Analysis Chart

Daily Diary

Largely cloudy and mild with a few sunny breaks, following some rain overnight. Further rain arrived during the evening/overnight associated with an occlusion, behind which was the main air mass change. Fresh to strong SW'ly wind veered sharply to moderate NW'ly, with gusts to gale inland more widely across England and Wales with some trees down and power outages.

RoostCam South Timelapse | RoostCam North Timelapse

Temperature and Dew Point on 13/03/2023
Line chart with 3 lines.
Click and drag in the plot area to zoom in. Time in Zulu
The chart has 1 X axis displaying Time. Range: 2023-03-13 08:45:36 to 2023-03-14 09:13:23.
The chart has 1 Y axis displaying Temperature/Dew Point. Range: 0 to 15.
Highcharts.com
End of interactive chart.

Rainfall on 13/03/2023
Line chart with 1440 data points.
Click and drag in the plot area to zoom in
The chart has 1 X axis displaying Time. Range: 2023-03-13 08:45:36 to 2023-03-14 09:13:23.
The chart has 1 Y axis displaying Rainfall. Range: -0.5 to 0.5.
Highcharts.com
End of interactive chart.

10-minute mean Wind Speed and Gust
Line chart with 2 lines.
Click and drag in the plot area to zoom in. Time in Zulu
The chart has 1 X axis displaying Time. Range: 2023-03-13 08:45:36 to 2023-03-14 09:13:23.
The chart has 1 Y axis displaying knots. Range: -0.5 to 0.5.
Highcharts.com
End of interactive chart.
Wind Direction
Line chart with 1440 data points.
Click and drag in the plot area to zoom in. Time in Zulu
The chart has 1 X axis displaying Time. Range: 2023-03-13 08:45:36 to 2023-03-14 09:13:23.
The chart has 1 Y axis displaying degrees. Range: 0 to 360.
Highcharts.com
End of interactive chart.
Wind Direction
Bar chart with 16 bars.
The chart has 1 X axis displaying categories.
The chart has 1 Y axis displaying Frequency (%). Range: -0.5 to 0.5.
Highcharts.com
End of interactive chart.
Table of Frequencies (percent)
Direction Frequency of Wind Direction
N 0
NNE 0
NE 0
ENE 0
E 0
ESE 0
SE 0
SSE 0
S 0
SSW 0
SW 0
WSW 0
W 0
WNW 0
NW 0
NNW 0
Total 25.53

Instantaneous PMSL
Line chart with 1440 data points.
Click and drag in the plot area to zoom in. Time in Zulu
The chart has 1 X axis displaying Time. Range: 2023-03-13 08:45:36 to 2023-03-14 09:13:23.
The chart has 1 Y axis displaying hPa. Range: 985 to 1010.
Highcharts.com
End of interactive chart.

Rolling 1-minute mean of Humidity
Line chart with 1440 data points.
Click and drag in the plot area to zoom in. Time in Zulu
The chart has 1 X axis displaying Time. Range: 2023-03-13 08:45:36 to 2023-03-14 09:13:23.
The chart has 1 Y axis displaying %. Range: 60 to 85.
Highcharts.com
End of interactive chart.

Cumulative Sunshine (hours)
Line chart with 1440 data points.
Click and drag in the plot area to zoom in
The chart has 1 X axis displaying Time. Range: 2023-03-12 23:45:36 to 2023-03-14 00:13:23.
The chart has 1 Y axis displaying hours. Range: 0 to 2.
Highcharts.com
End of interactive chart.
 
 
Buy Me A Coffee
Please consider supporting my site with a donation towards the ever increasing running costs!