Previous Year | Previous Day | Next Day | Next Year |

Saturday April 13th 2024 - number of obs: 1440 (100%)

TemperatureHumidity
Maximum
16.4°Cat 13:48
Maximum
94.0 %at 06:18
Minimum
6.4°Cat 05:47
Minimum
67.0 %at 11:20
Average11.4°C Average83.1 %
Rain (21Z D-1 to 21Z D)Sunshine
Total0.0 mmTotal6.2 hours
PressureWind
Highest
1026.6 hPaat 07:06
Max Mean
7 knotsat 15:11
Lowest
1022.2 hPaat 14:20
Max Gust
14 knotsat 15:40
Remarks
DAVIS

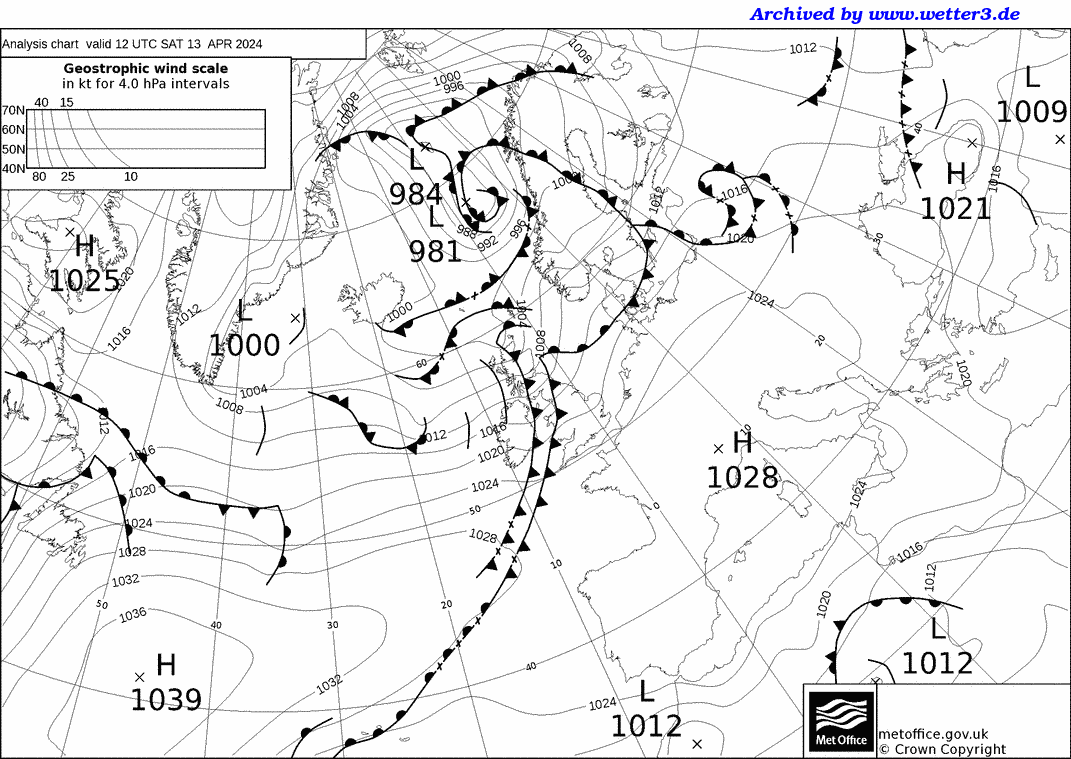
Met Office 12Z Analysis Chart

Daily Diary

Another fine day with good sunny spells but plenty of high cloud around at times too. Not quite as warm as previous day, but still well above average. A weak cold front crossed the area during the afternoon but was not associated with any rain. Light W'ly winds.

RoostCam South Timelapse | RoostCam North Timelapse

Temperature and Dew Point on 13/04/2024
Line chart with 3 lines.
Click and drag in the plot area to zoom in. Time in Zulu
The chart has 1 X axis displaying Time. Range: 2024-04-13 08:45:36 to 2024-04-14 09:13:23.
The chart has 1 Y axis displaying Temperature/Dew Point. Range: 0 to 40.
Highcharts.com
End of interactive chart.

Rainfall on 13/04/2024
Line chart with 1440 data points.
Click and drag in the plot area to zoom in
The chart has 1 X axis displaying Time. Range: 2024-04-13 08:45:36 to 2024-04-14 09:13:23.
The chart has 1 Y axis displaying Rainfall. Range: -0.5 to 0.5.
Highcharts.com
End of interactive chart.

10-minute mean Wind Speed and Gust
Line chart with 2 lines.
Click and drag in the plot area to zoom in. Time in Zulu
The chart has 1 X axis displaying Time. Range: 2024-04-13 08:45:36 to 2024-04-14 09:13:23.
The chart has 1 Y axis displaying knots. Range: 0 to 15.
Highcharts.com
End of interactive chart.
Wind Direction
Line chart with 1440 data points.
Click and drag in the plot area to zoom in. Time in Zulu
The chart has 1 X axis displaying Time. Range: 2024-04-13 08:45:36 to 2024-04-14 09:13:23.
The chart has 1 Y axis displaying degrees. Range: 0 to 360.
Highcharts.com
End of interactive chart.
Wind Direction
Bar chart with 16 bars.
The chart has 1 X axis displaying categories.
The chart has 1 Y axis displaying Frequency (%). Range: 0 to 46.2.
Highcharts.com
End of interactive chart.
Table of Frequencies (percent)
Direction Frequency of Wind Direction
N 3
NNE 1
NE 0
ENE 0
E 1
ESE 0
SE 0
SSE 1
S 0
SSW 1
SW 0
WSW 3
W 44
WNW 24
NW 1
NNW 0
Total 25.53

Instantaneous PMSL
Line chart with 1440 data points.
Click and drag in the plot area to zoom in. Time in Zulu
The chart has 1 X axis displaying Time. Range: 2024-04-13 08:45:36 to 2024-04-14 09:13:23.
The chart has 1 Y axis displaying hPa. Range: 1021 to 1027.
Highcharts.com
End of interactive chart.

Rolling 1-minute mean of Humidity
Line chart with 1440 data points.
Click and drag in the plot area to zoom in. Time in Zulu
The chart has 1 X axis displaying Time. Range: 2024-04-13 08:45:36 to 2024-04-14 09:13:23.
The chart has 1 Y axis displaying %. Range: 60 to 100.
Highcharts.com
End of interactive chart.

Cumulative Sunshine (hours)
Line chart with 1321 data points.
Click and drag in the plot area to zoom in
The chart has 1 X axis displaying Time. Range: 2024-04-13 00:46:48 to 2024-04-13 23:13:12.
The chart has 1 Y axis displaying hours. Range: 0 to 8.
Highcharts.com
End of interactive chart.
 
 
Buy Me A Coffee
Please consider supporting my site with a donation towards the ever increasing running costs!