Previous Year | Previous Day | Next Day | Next Year |

Saturday May 25th 2024 - number of obs: 1440 (100%)

TemperatureHumidity
Maximum
16.8°Cat 12:39
Maximum
95.0 %at 01:23
Minimum
11.2°Cat 22:32
Minimum
54.0 %at 09:20
Average14.0°C Average79.4 %
Rain (21Z D-1 to 21Z D)Sunshine
Total2.1 mmTotal7.8 hours
PressureWind
Highest
1017.5 hPaat 09:02
Max Mean
6 knotsat 09:43
Lowest
1009.3 hPaat 02:57
Max Gust
12 knotsat 09:43
Remarks
DAVIS

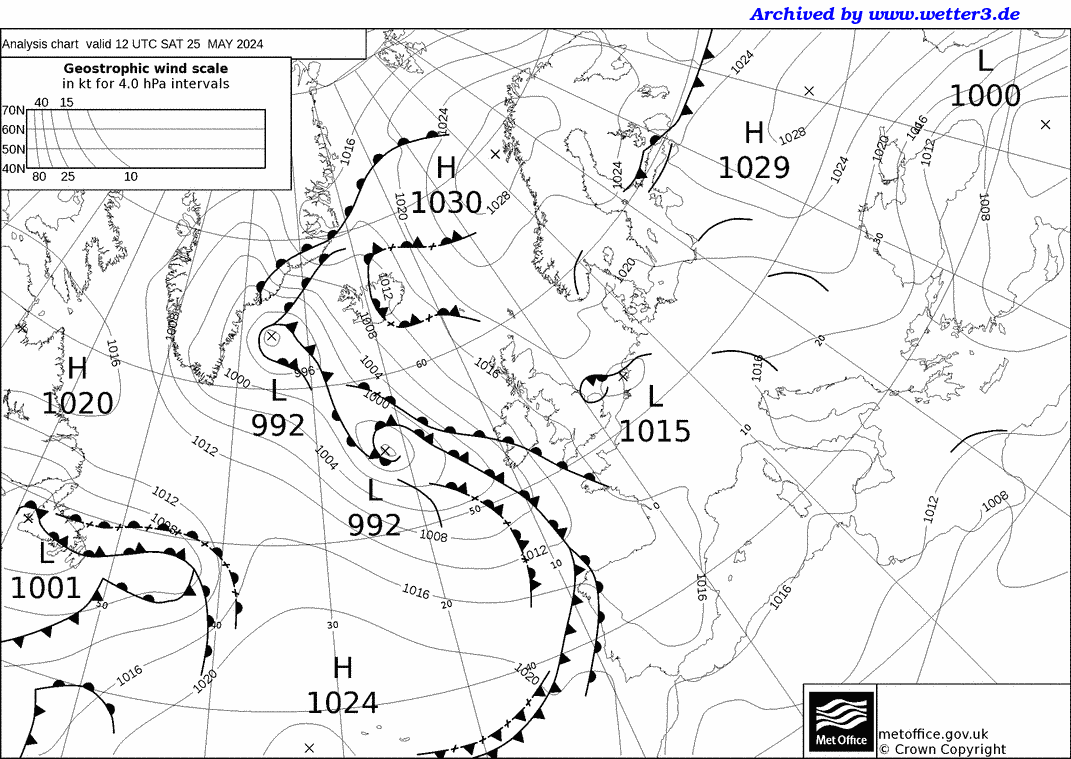
Met Office 12Z Analysis Chart

Daily Diary

A fine, sunny morning and afternoon which became increasingly cloudy as high and then medium cloud invaded from the SW ahead of a warm front. Rain arrived late in the afternoon and persisted for several hours overnight, with some heavy bursts at times, only clearing during the early hours. Light to moderate S'ly winds, with temperatures around average by day, and mild overnight.

RoostCam South Timelapse | RoostCam North Timelapse

Temperature and Dew Point on 25/05/2024
Line chart with 3 lines.
Click and drag in the plot area to zoom in. Time in Zulu
The chart has 1 X axis displaying Time. Range: 2024-05-25 08:45:36 to 2024-05-26 09:13:23.
The chart has 1 Y axis displaying Temperature/Dew Point. Range: 0 to 50.
Highcharts.com
End of interactive chart.

Rainfall on 25/05/2024
Line chart with 1440 data points.
Click and drag in the plot area to zoom in
The chart has 1 X axis displaying Time. Range: 2024-05-25 08:45:36 to 2024-05-26 09:13:23.
The chart has 1 Y axis displaying Rainfall. Range: 0 to 8.
Highcharts.com
End of interactive chart.

10-minute mean Wind Speed and Gust
Line chart with 2 lines.
Click and drag in the plot area to zoom in. Time in Zulu
The chart has 1 X axis displaying Time. Range: 2024-05-25 08:45:36 to 2024-05-26 09:13:23.
The chart has 1 Y axis displaying knots. Range: 0 to 14.
Highcharts.com
End of interactive chart.
Wind Direction
Line chart with 1440 data points.
Click and drag in the plot area to zoom in. Time in Zulu
The chart has 1 X axis displaying Time. Range: 2024-05-25 08:45:36 to 2024-05-26 09:13:23.
The chart has 1 Y axis displaying degrees. Range: 0 to 360.
Highcharts.com
End of interactive chart.
Wind Direction
Bar chart with 16 bars.
The chart has 1 X axis displaying categories.
The chart has 1 Y axis displaying Frequency (%). Range: 0 to 25.2.
Highcharts.com
End of interactive chart.
Table of Frequencies (percent)
Direction Frequency of Wind Direction
N 0
NNE 0
NE 0
ENE 1
E 10
ESE 9
SE 7
SSE 10
S 24
SSW 17
SW 12
WSW 1
W 0
WNW 0
NW 0
NNW 0
Total 25.53

Instantaneous PMSL
Line chart with 1440 data points.
Click and drag in the plot area to zoom in. Time in Zulu
The chart has 1 X axis displaying Time. Range: 2024-05-25 08:45:36 to 2024-05-26 09:13:23.
The chart has 1 Y axis displaying hPa. Range: 1008 to 1018.
Highcharts.com
End of interactive chart.

Rolling 1-minute mean of Humidity
Line chart with 1440 data points.
Click and drag in the plot area to zoom in. Time in Zulu
The chart has 1 X axis displaying Time. Range: 2024-05-25 08:45:36 to 2024-05-26 09:13:23.
The chart has 1 Y axis displaying %. Range: 50 to 100.
Highcharts.com
End of interactive chart.

Cumulative Sunshine (hours)
Line chart with 1321 data points.
Click and drag in the plot area to zoom in
The chart has 1 X axis displaying Time. Range: 2024-05-25 00:46:48 to 2024-05-25 23:13:12.
The chart has 1 Y axis displaying hours. Range: 0 to 10.
Highcharts.com
End of interactive chart.
 
 
Buy Me A Coffee
Please consider supporting my site with a donation towards the ever increasing running costs!