Previous Year | Previous Day | Next Day | Next Year |

Thursday August 1st 2024 - number of obs: 1440 (100%)

TemperatureHumidity
Maximum
25.0°Cat 13:26
Maximum
92.0 %at 04:15
Minimum
14.2°Cat 03:49
Minimum
54.0 %at 13:35
Average19.6°C Average76.4 %
Rain (21Z D-1 to 21Z D)Sunshine
Total0.7 mmTotal7.9 hours
PressureWind
Highest
1015.6 hPaat 21:46
Max Mean
4 knotsat 14:19
Lowest
1013.9 hPaat 13:03
Max Gust
10 knotsat 14:18
Remarks
DAVIS

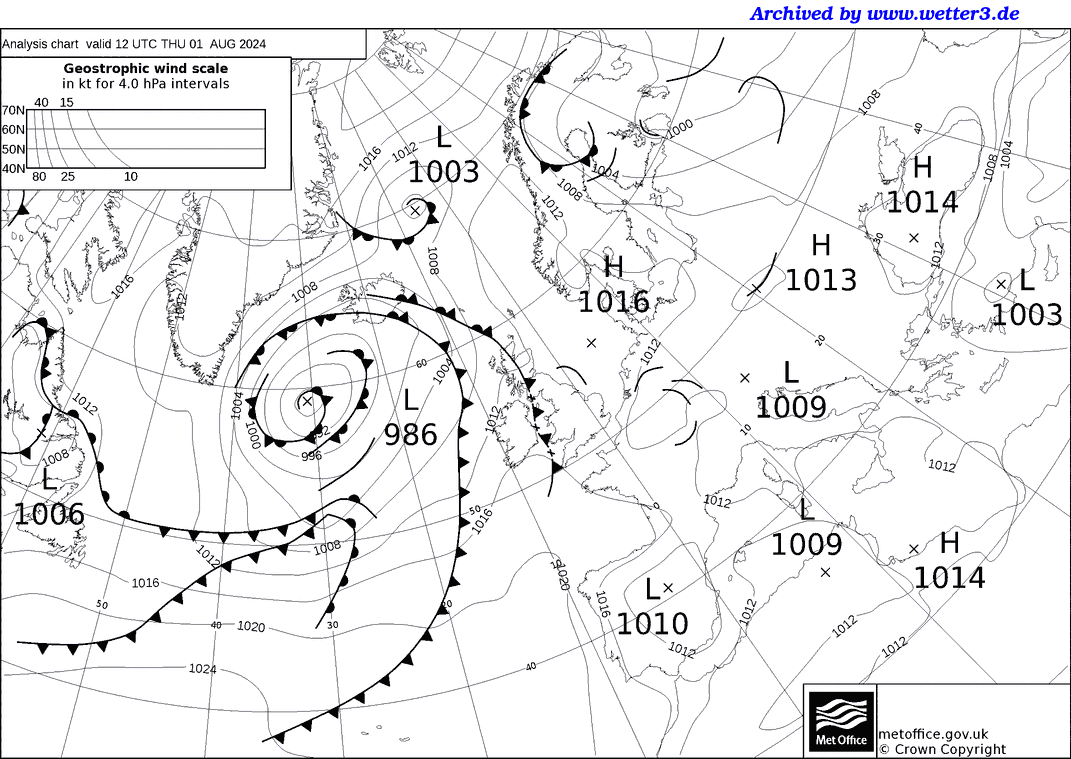
Met Office 12Z Analysis Chart

Daily Diary

Following some showery rain overnight, a fine, fairly sunny and warm day with areas of high and medium cloud at times, often unstable. Light, mainly WNW'ly winds.

RoostCam South Timelapse | RoostCam North Timelapse

Temperature and Dew Point on 01/08/2024
Line chart with 3 lines.
Click and drag in the plot area to zoom in. Time in Zulu
The chart has 1 X axis displaying Time. Range: 2024-08-01 08:45:36 to 2024-08-02 09:13:23.
The chart has 1 Y axis displaying Temperature/Dew Point. Range: 10 to 50.
Highcharts.com
End of interactive chart.

Rainfall on 01/08/2024
Line chart with 1440 data points.
Click and drag in the plot area to zoom in
The chart has 1 X axis displaying Time. Range: 2024-08-01 08:45:36 to 2024-08-02 09:13:23.
The chart has 1 Y axis displaying Rainfall. Range: -0.8 to 0.
Highcharts.com
End of interactive chart.

10-minute mean Wind Speed and Gust
Line chart with 2 lines.
Click and drag in the plot area to zoom in. Time in Zulu
The chart has 1 X axis displaying Time. Range: 2024-08-01 08:45:36 to 2024-08-02 09:13:23.
The chart has 1 Y axis displaying knots. Range: 0 to 12.
Highcharts.com
End of interactive chart.
Wind Direction
Line chart with 1440 data points.
Click and drag in the plot area to zoom in. Time in Zulu
The chart has 1 X axis displaying Time. Range: 2024-08-01 08:45:36 to 2024-08-02 09:13:23.
The chart has 1 Y axis displaying degrees. Range: 0 to 360.
Highcharts.com
End of interactive chart.
Wind Direction
Bar chart with 16 bars.
The chart has 1 X axis displaying categories.
The chart has 1 Y axis displaying Frequency (%). Range: 0 to 27.3.
Highcharts.com
End of interactive chart.
Table of Frequencies (percent)
Direction Frequency of Wind Direction
N 5
NNE 0
NE 0
ENE 0
E 0
ESE 1
SE 1
SSE 0
S 0
SSW 0
SW 1
WSW 5
W 21
WNW 26
NW 16
NNW 6
Total 25.53

Instantaneous PMSL
Line chart with 1440 data points.
Click and drag in the plot area to zoom in. Time in Zulu
The chart has 1 X axis displaying Time. Range: 2024-08-01 08:45:36 to 2024-08-02 09:13:23.
The chart has 1 Y axis displaying hPa. Range: 1013 to 1016.
Highcharts.com
End of interactive chart.

Rolling 1-minute mean of Humidity
Line chart with 1440 data points.
Click and drag in the plot area to zoom in. Time in Zulu
The chart has 1 X axis displaying Time. Range: 2024-08-01 08:45:36 to 2024-08-02 09:13:23.
The chart has 1 Y axis displaying %. Range: 50 to 100.
Highcharts.com
End of interactive chart.

Cumulative Sunshine (hours)
Line chart with 1321 data points.
Click and drag in the plot area to zoom in
The chart has 1 X axis displaying Time. Range: 2024-08-01 00:46:48 to 2024-08-01 23:13:12.
The chart has 1 Y axis displaying hours. Range: 0 to 10.
Highcharts.com
End of interactive chart.
 
 
Buy Me A Coffee
Please consider supporting my site with a donation towards the ever increasing running costs!