Previous Year | Previous Day | Next Day | Next Year |

Thursday January 9th 2025 - number of obs: 1440 (100%)

TemperatureHumidity
Maximum
6.3°Cat 14:02
Maximum
96.0 %at 09:32
Minimum
-2.6°Cat 09:01
Minimum
73.0 %at 14:14
Average1.9°C Average90.7 %
Rain (21Z D-1 to 21Z D)Sunshine
Total0.0 mmTotal3.8 hours
PressureWind
Highest
1018.3 hPaat 22:16
Max Mean
6 knotsat 14:56
Lowest
1009.3 hPaat 09:01
Max Gust
10 knotsat 14:14
Remarks
DAVIS

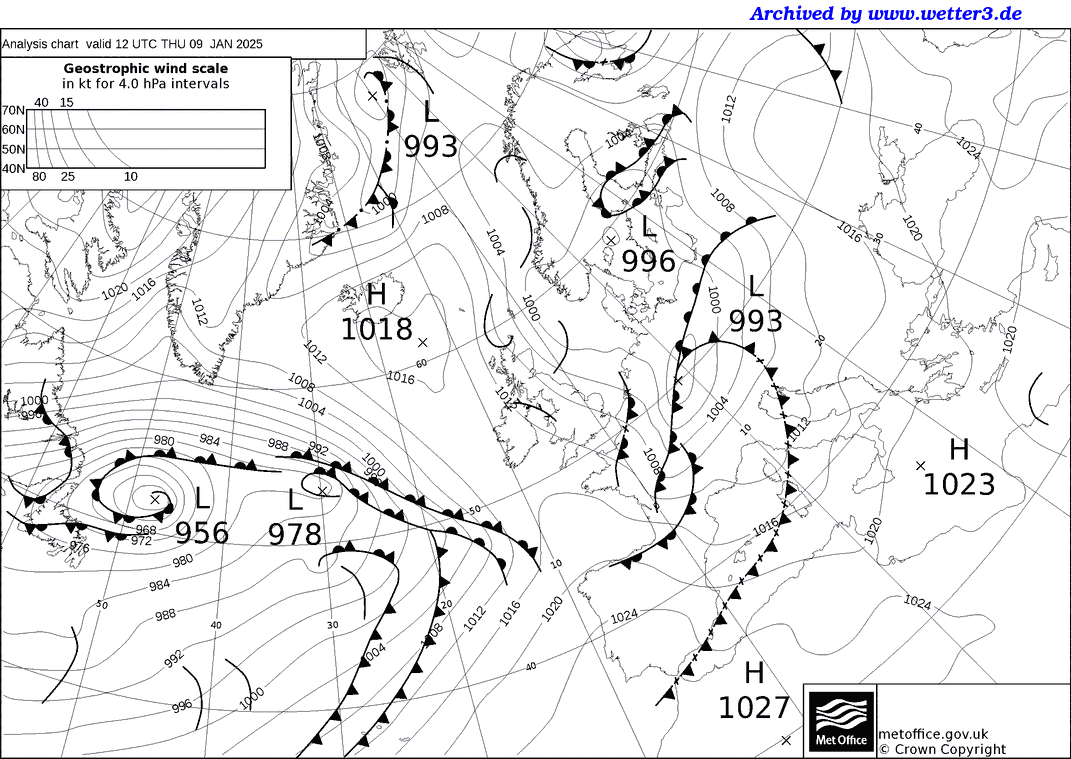
Met Office 12Z Analysis Chart

Daily Diary

A cold, icy start led into a crisp, sunny but rather cold day with light to moderate NNW'ly winds. Temperatures fell sharply again the following evening with clear skies.

RoostCam South Timelapse | RoostCam North Timelapse

Temperature and Dew Point on 09/01/2025
Line chart with 3 lines.
Click and drag in the plot area to zoom in. Time in Zulu
The chart has 1 X axis displaying Time. Range: 2025-01-09 08:45:36 to 2025-01-10 09:13:23.
The chart has 1 Y axis displaying Temperature/Dew Point. Range: -6 to 8.
Highcharts.com
End of interactive chart.

Rainfall on 09/01/2025
Line chart with 1440 data points.
Click and drag in the plot area to zoom in
The chart has 1 X axis displaying Time. Range: 2025-01-09 08:45:36 to 2025-01-10 09:13:23.
The chart has 1 Y axis displaying Rainfall. Range: -0.5 to 0.5.
Highcharts.com
End of interactive chart.

10-minute mean Wind Speed and Gust
Line chart with 2 lines.
Click and drag in the plot area to zoom in. Time in Zulu
The chart has 1 X axis displaying Time. Range: 2025-01-09 08:45:36 to 2025-01-10 09:13:23.
The chart has 1 Y axis displaying knots. Range: 0 to 12.
Highcharts.com
End of interactive chart.
Wind Direction
Line chart with 1440 data points.
Click and drag in the plot area to zoom in. Time in Zulu
The chart has 1 X axis displaying Time. Range: 2025-01-09 08:45:36 to 2025-01-10 09:13:23.
The chart has 1 Y axis displaying degrees. Range: 0 to 360.
Highcharts.com
End of interactive chart.
Wind Direction
Bar chart with 16 bars.
The chart has 1 X axis displaying categories.
The chart has 1 Y axis displaying Frequency (%). Range: 0 to 13.65.
Highcharts.com
End of interactive chart.
Table of Frequencies (percent)
Direction Frequency of Wind Direction
N 7
NNE 0
NE 0
ENE 1
E 0
ESE 0
SE 0
SSE 0
S 0
SSW 0
SW 0
WSW 0
W 10
WNW 9
NW 6
NNW 13
Total 25.53

Instantaneous PMSL
Line chart with 1440 data points.
Click and drag in the plot area to zoom in. Time in Zulu
The chart has 1 X axis displaying Time. Range: 2025-01-09 08:45:36 to 2025-01-10 09:13:23.
The chart has 1 Y axis displaying hPa. Range: 1008 to 1020.
Highcharts.com
End of interactive chart.

Rolling 1-minute mean of Humidity
Line chart with 1440 data points.
Click and drag in the plot area to zoom in. Time in Zulu
The chart has 1 X axis displaying Time. Range: 2025-01-09 08:45:36 to 2025-01-10 09:13:23.
The chart has 1 Y axis displaying %. Range: 70 to 100.
Highcharts.com
End of interactive chart.

Cumulative Sunshine (hours)
Line chart with 1321 data points.
Click and drag in the plot area to zoom in
The chart has 1 X axis displaying Time. Range: 2025-01-09 00:46:48 to 2025-01-09 23:13:12.
The chart has 1 Y axis displaying hours. Range: 0 to 4.
Highcharts.com
End of interactive chart.
 
 
Buy Me A Coffee
Please consider supporting my site with a donation towards the ever increasing running costs!