World Climate Map
|
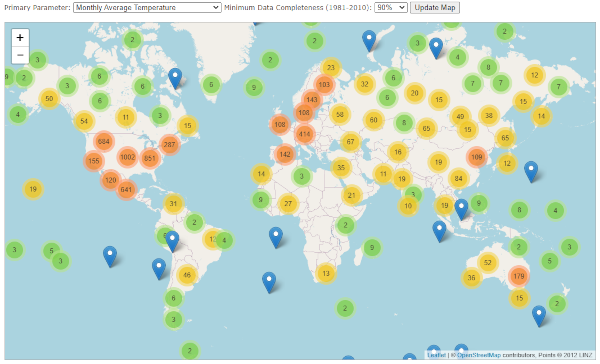
The World Climate Map brings together a number of data sources of global monthly station climatology, and presents it in an easy to use format. The sheer volume of data in the underlying database means that it is impractical to display all stations on the map at once. Therefore, filtering is applied based on the percentage of data available within the 1981-2010 climate period for the primary parameter of interest. Both the parameter, and percentage data threshold can be varied, and more sophisticate filtering and querying of the data is a likely future development. Clicking on any of the numbered icons will zoom in and expand until individual station locations are shown. Clicking on these points will open a pop-up, showing the name of the station, and the source from which the data is derived. Clicking this will take you to the graphs page. |
|
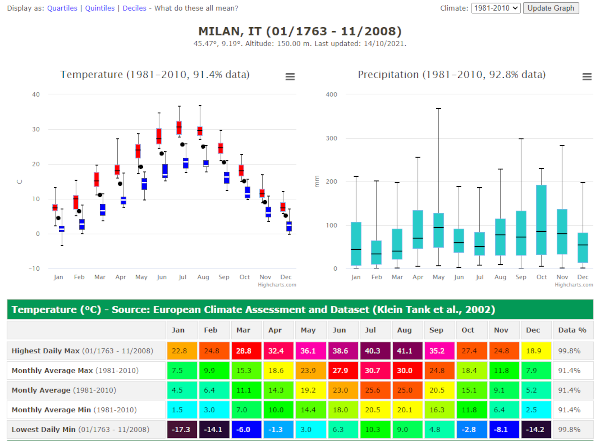
The graphs page will display graphs and summary tables of parameters available for the selected station. The graphs will display data from the climate period selected; this defaults to 1981-2010 but can be configured using the drop down menu at the top-right of the page. The graph shows quartiles by default, but again this can be changed, using the options displayed top-left. Please note that currently, even if Quintiles or Deciles are selected, the graph tooltip information will still be labelled Quartiles, but the underlying data will be correct. The title of each graph indicates the percentage of months, out of the total (for example 360 in a 30-year climate) that are available in the dataset. The summary tables show similar information. The mean, rather than the median is given in the tables, hence there will likely be slight differences for the "middle" value of the climate. The period for each variable is shown in the labels on the left hand side; for extreme values the entire dataset is sampled, and for climate averages the climate period selected is displayed. Hovering over extreme values will bring up a tooltip, showing the date on which the extreme was achieved. Finally, on the right hand side, again the completeness of the data within the period shown is given. |
|
Release Notes
- 14/04/2021 - Launched World Climate Map.
- 15/10/2021 - Re-launched World Climate Map, with a few bug fixes and climates updated to the end of August 2021.
- 15/10/2021 - Wrote first draft of instructions for using the map and graphs.
- 11/11/2021 - Added an option to select which data-types (UKMO, GSOM or CLIMAT) to plot and whch to ignore.