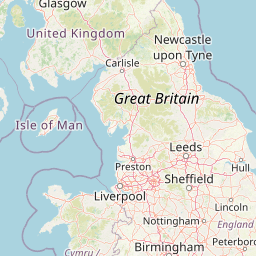
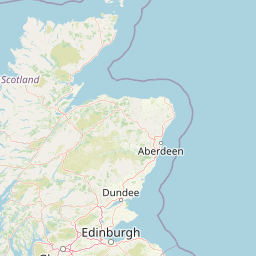
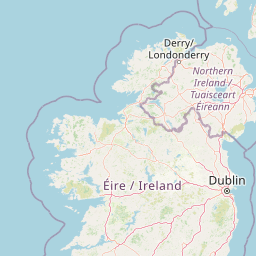
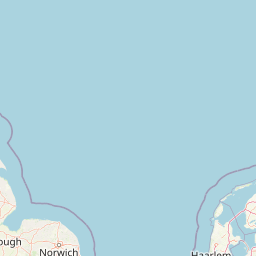
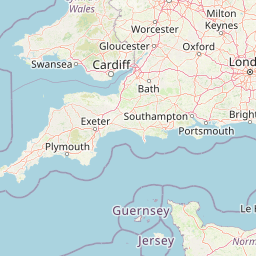
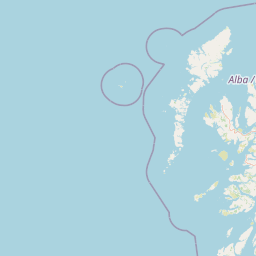
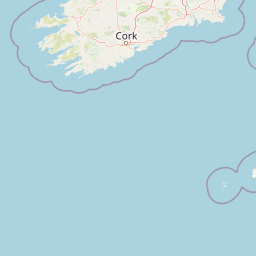
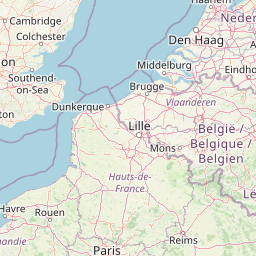
Daily Max Temperature Anomalies (with respect to '91-'20 climate) observed on 4th Jul 1989 (191 reports).
Date (09Z D to 09Z D+1)
-1 day
+1 day UK Climate:
51-80
61-90
71-00
81-10
91-20
Anomalies Percentiles
UK only UK Plus
View Max Temperature Map
View Max Temperature Table

Highest 10
Wick Airport (36m, max of 09-21Z D/21Z-09Z D+1)+8.3 degC
Balmoral (283m, 24h max at 09Z D+1)+8.3 degC
Lossiemouth (7m, max of 09-21Z D/21Z-09Z D+1)+8.0 degC
Kirkwall (26m, max of 09-21Z D/21Z-09Z D+1)+7.9 degC
Leuchars (10m, max of 09-21Z D/21Z-09Z D+1)+7.7 degC
Penicuik (185m, 24h max at 09Z D+1)+7.6 degC
Kinloss (5m, max of 09-21Z D/21Z-09Z D+1)+7.5 degC
Craibstone (102m, 24h max at 09Z D+1)+7.5 degC
Aviemore (228m, max of 09-21Z D/21Z-09Z D+1)+7.4 degC
Durris (107m, 24h max at 09Z D+1)+7.4 degC

Lowest 10
Skegness (6m, 24h max at 09Z D+1)-1.5 degC
Scarborough (110m, 24h max at 09Z D+1)-0.7 degC
Cromer (37m, 24h max at 09Z D+1)-0.6 degC
Manston (49m, max of 09-21Z D/21Z-09Z D+1)-0.4 degC
Whitby (41m, 24h max at 09Z D+1)-0.4 degC
Boulmer (23m, max of 09-21Z D/21Z-09Z D+1)-0.1 degC
Langdon Bay (117m, 24h max at 09Z D+1)+0.6 degC
Denver (3m, 24h max at 09Z D+1)+0.8 degC
Northampton, Moulton Park (127m, 24h max at 09Z D+1)+0.9 degC
Murlough (12m, 24h max at 09Z D+1)+1.0 degC

Average Anomaly = 3.9 degC

Data courtesy of MetOffice and OGIMET
OpenMIDAS Data - Met Office (2022): MIDAS Open: UK daily temperature data, v202207. NERC EDS Centre for Environmental Data Analysis.


UK temperature anomalies are plotted by default with respect to 1991-2020 daily climate, calculated for each individual UK site using official observation data. You can select a 30 year climate base period of your choice between 1951-1980 and 1991-2020 by selecting the appropriate radio button in the display. The daily climate is calculated by taking a 15-day rolling mean centred on the day in question, and can be visualised (with further info) here: Daily Climate.

Temperature percentiles are calculated using a 15-day climate centred on the relevant date, the climate itself using all available observations within that time window. Currently only available for UK sites.

Temperature anomalies for the Republic of Ireland are currently calculated using interpolated monthly means for the period 1981-2010, so in order to be consistent when comparing UK and ROI anomalies, select 81-10 as the climate using the radio buttons in the display window.

Page load and execution time: 0.6 seconds.


Buy Me A Coffee
Please consider supporting my site with a donation towards the ever increasing running costs!