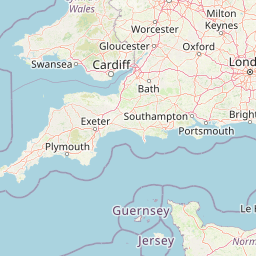
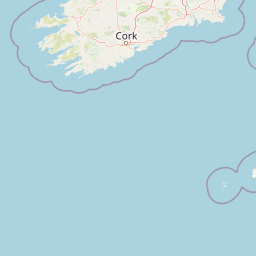
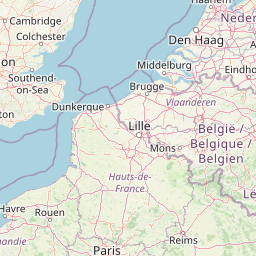
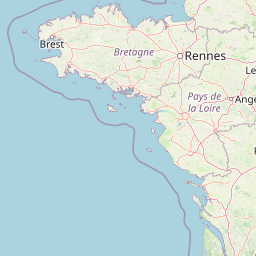
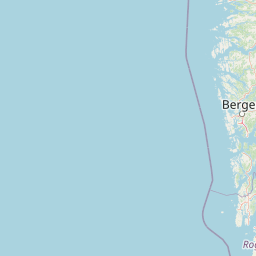
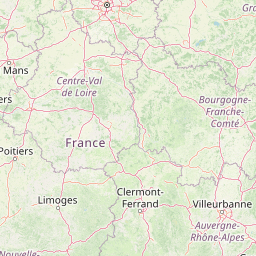
Daily Mean Temperatures ([Max+Min]/2) observed on 28th Apr 2025 (247 reports).
Date
-1 day
+1 day
UK only UK & ROI
View Mean Anomaly Map
View Mean Temperature Table

Highest 10
Shannon Airport (14m)15.7°C
Finner (39m)15.6°C
London, St James\'s Park (5m)15.5°C
Lossiemouth (7m)15.5°C
Killowen (4m)15.5°C
Kinloss (5m)15.4°C
Edinburgh, Royal Botanic Garden No 2 (28m)15.4°C
Magilligan No 2 (6m)15.3°C
Fyvie Castle (55m)15.3°C
Casement Aerodrome (97m)15.2°C


Lowest 10
Cairnwell (928m)6.7°C
Bealach Na Ba No 2 (773m)7.6°C
Sennybridge No 2 (307m)9.7°C
Fair Isle (57m)10.0°C
Culdrose (76m)10.0°C
Eskdalemuir (236m)10.1°C
Swyddffynnon (178m)10.4°C
Pembrey Sands (3m)10.4°C
Dundrennan (113m)10.7°C
Lerwick (82m)10.7°C

Data courtesy of MetOffice and OGIMET
OpenMIDAS Data - Met Office: MIDAS Open: UK daily temperature data, NERC EDS Centre for Environmental Data Analysis.


This map shows daily mean temperatures from official sites, combining data from non-QC'd SYNOPs and the Met Office's QC'd MIDAS database. These are estimated from the 18-06Z min and 06-18Z max (for SYNOPs), or 24 hour climate min and the 24 hour climate max (effectively 09Z D-1 to 09Z D+1) for MIDAS data.

Temperature data is available back to 1853, to the present day. All times quoted are GMT.


Page load and execution time: 0.5 seconds.


Buy Me A Coffee
Please consider supporting my site with a donation towards the ever increasing running costs!