| Current (bold) and maximum (italic) dry and wet streaks using UKP series data, as of 24/04/2025 | ||||
|---|---|---|---|---|
| Region | Consecutive <0.2 mm | Consecutive <1 mm | Consecutive >0.2 mm | Consecutive >1 mm |
| UK | 2 | 1 | ||
| 19 (09/06/2023) | 30 (03/09/1947) | 190 (16/02/2013) | 65 (06/09/1960) | |
| 8 (11/04/2025) | 14 (12/04/2025) | 63 (14/01/2025) | 8 (26/02/2025) | |
| Scotland | 1 | 3 | ||
| 23 (29/08/1947) | 32 (03/03/1932) | 147 (16/02/2013) | 63 (29/12/1949) | |
| 13 (11/04/2025) | 14 (12/04/2025) | 31 (09/01/2025) | 22 (03/01/2025) | |
| Northern Ireland | 1 | 1 | ||
| 28 (31/07/1955) | 33 (03/03/1932) | 73 (21/11/1935) | 32 (21/01/1948) | |
| 13 (11/04/2025) | 14 (12/04/2025) | 26 (07/01/2025) | 10 (26/02/2025) | |
| England & Wales | 2 | 2 | ||
| 24 (16/09/1959) | 38 (27/08/1976) | 107 (19/12/2000) | 31 (09/12/2009) | |
| 8 (11/04/2025) | 17 (13/04/2025) | 16 (14/01/2025) | 8 (30/01/2025) | |
| Northern Scotland | 1 | 3 | ||
| 24 (29/08/1947) | 36 (26/04/1974) | 128 (30/12/1954) | 80 (24/03/1990) | |
| 11 (10/04/2025) | 13 (11/04/2025) | 57 (09/01/2025) | 21 (02/01/2025) | |
| Southern Scotland | 3 | 2 | ||
| 31 (02/09/1947) | 35 (07/08/1955) | 90 (09/03/2014) | 41 (31/12/1974) | |
| 13 (11/04/2025) | 14 (12/04/2025) | 29 (09/01/2025) | 9 (27/01/2025) | |
| Eastern Scotland | 6 | 6 | ||
| 25 (01/09/1947) | 37 (27/04/1974) | 46 (06/03/1937) | 20 (17/11/1977) | |
| 14 (12/04/2025) | 14 (12/04/2025) | 10 (24/02/2025) | 6 (28/01/2025) | |
| Northwest England | 2 | 2 | ||
| 30 (04/09/1947) | 40 (04/03/1932) | 77 (18/01/2016) | 56 (17/01/2016) | |
| 13 (11/04/2025) | 14 (20/03/2025) | 9 (28/01/2025) | 9 (28/01/2025) | |
| Northeast England | 3 | 3 | ||
| 29 (16/06/2023) | 39 (27/03/1953) | 51 (01/01/1960) | 18 (17/12/1937) | |
| 15 (13/04/2025) | 17 (13/04/2025) | 11 (30/01/2025) | 5 (11/02/2025) | |
| Central England | 2 | 2 | ||
| 32 (06/09/1947) | 39 (11/09/1947) | 53 (21/12/2009) | 18 (03/05/2012) | |
| 16 (12/04/2025) | 22 (13/04/2025) | 9 (28/01/2025) | 4 (26/02/2025) | |
| Southwest England | 2 | 2 | ||
| 26 (03/07/1949) | 43 (04/03/1932) | 75 (21/11/1935) | 34 (20/11/2023) | |
| 8 (11/04/2025) | 14 (20/03/2025) | 31 (11/01/2025) | 9 (30/01/2025) | |
| Southeast England | 2 | 2 | ||
| 37 (26/08/1976) | 51 (24/04/1997) | 37 (14/12/1960) | 20 (27/11/1960) | |
| 20 (12/04/2025) | 22 (20/03/2025) | 8 (26/02/2025) | 6 (31/01/2025) | |
Notes
The table shows the current and maximum dry and wet streaks based on UKP series data for a number of regions across the UK. In italics, underneath each daily figure, is a figure for the maximum streak in the
record, and then the maximum streak which ended in this calendar year, along with the date on which these streaks were achieved. Ongoing streaks are highlighted in bold.
Data are updated once per day, and are usually a couple of days behind the current date.
Data comes from the Met Office National Climate Information Centre, and can be found here.
The UK series is estimated from an area weighted combination of the England & Wales, Scotland, and Northern Ireland series.
For further details please see Alexander, L.V. and Jones, P.D. (2001) Updated precipitation series for the U.K. and discussion of recent extremes, Atmospheric Science Letters doi:10.1006/asle.2001.0025.
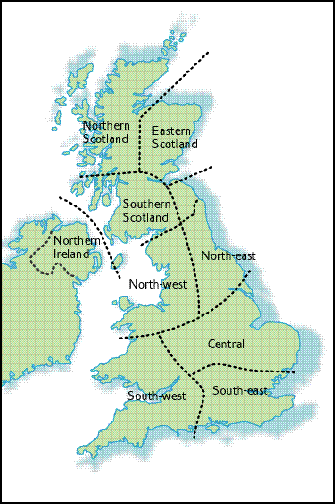
The regions used in the UKP series are shown below - the figures are derived from the average of numerous rain gauge measurements within each region, from sites with long-standing records.
