| Site climatologies (1991-2020) subset by prevailing wind direction - click a point to view details | ||
|---|---|---|
All data comes from official observation locations which have data present in the Met Office's MIDAS database, and post processed here at the Roost.
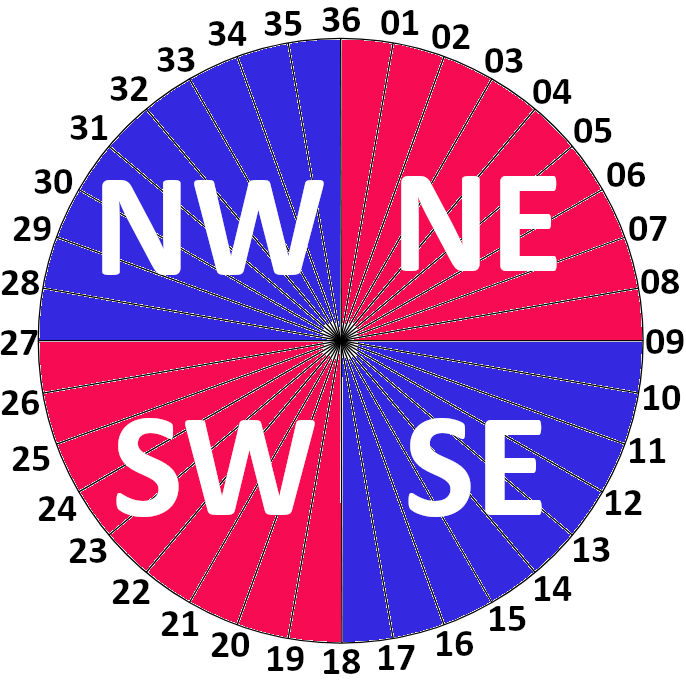
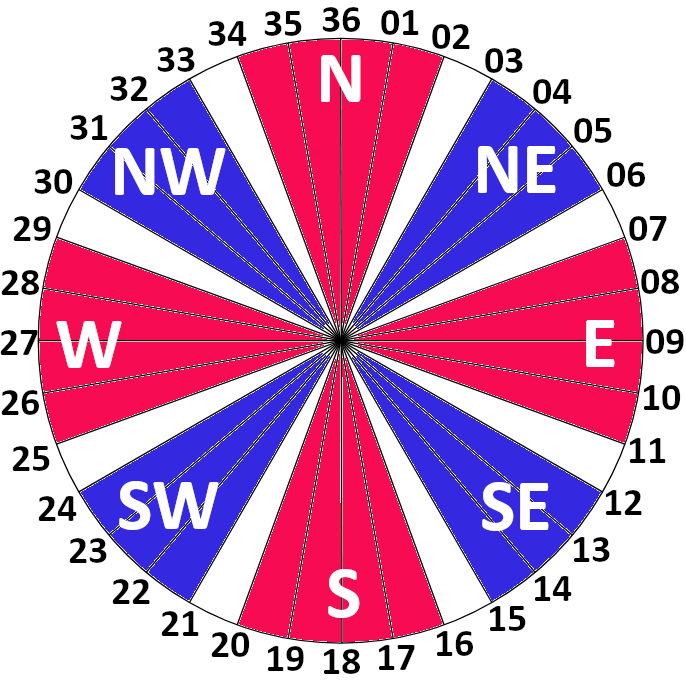
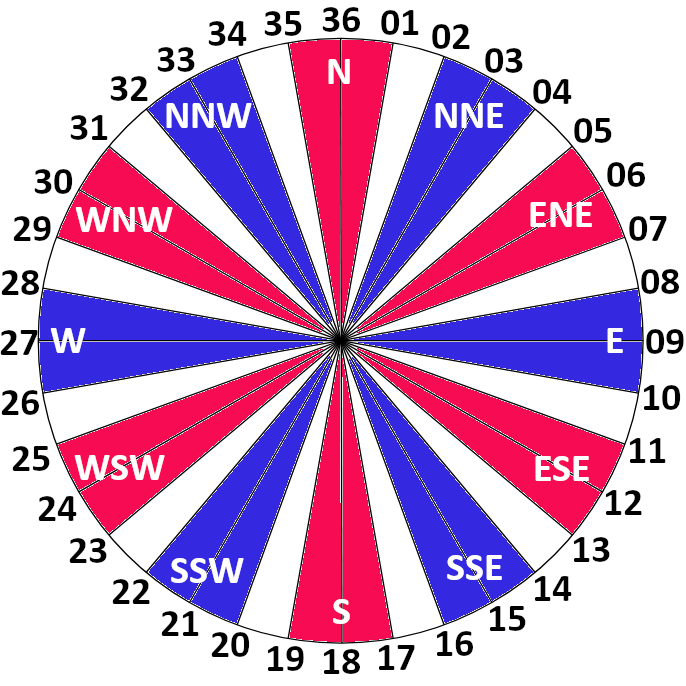
For each day between 01/01/1991 and 31/12/2020, a modal wind direction was calculated from the hourly observations; 12 or more hourly observations were considered a requirement before a modal wind direction could be assigned. 3 different compasses were used, the segments of which for some purposes can be combined further to create custom segments.
 |
 |
 |
| 4-segment compass | 8-segment compass | 12-segment compass |
Wind directions are reported to the nearest 10°, which gives 36 possible directions. Unfortunately, this doesn't divide evenly into an 8- or 16-point compass, so some choices were made about how exactly to assign each direction to each compass segment. For the 4-point compass, quadrants were calculated between 0-90, 90-180, etc, with the idea that if quadrants centred about due N, due E etc were required, these could be approximated using multiple segments from the 12-point compass. Winds that were due N, due E etc, were simultaneously assigned to both quadrants either side (eg a due E wind would count as an observation in NE and SE). The 8-point compass was aligned as best as possible with the traditional directions, but each major direction has 5 bearings assigned to it, and each minor direction only 4 (due to the imperfect division of the circle). A 12-point compass was also calculated instead of a 16-point compass, such that 3 bearings could be attributed to each segment.
With the climatology of wind directions calculated, climatologies for other parameters could be calculated as a function of dominant wind direction. Only days where a distinct, dominant direction was present were used to calculate each climatology; days with more than one dominant direction, or days with missing data (either wind or other parameter) were omitted. The number of days forming each climatology, and the maximum possible count, are shown both in the polar plots and the table beneath them. Use these to inform your judgement as to whether the displayed climate is representative for that specific location.
Thanks to Dan Holley for ideas and lots of discussion in the initial phase of calculating the climatologies.